SweetViz: Streamlining EDA with Elegant Visualizations
SweetViz, an open-source Python library, simplifies the process of Exploratory Data Analysis (EDA) with just two lines of code, generating stunning, high-density visualizations. The output is a fully self-contained HTML application, making it a convenient tool for quick insights into data characteristics and comparisons between datasets.

Key Features:
- Target Analysis: Visualize how a target value (e.g., "Survived" in the Titanic dataset) correlates with other features, aiding in understanding target characteristics.
- Visualize and Compare: Effortlessly compare distinct datasets, such as training versus test data, and explore intra-set characteristics (e.g., male versus female).
- Mixed-Type Associations: SweetViz seamlessly integrates associations for numerical (Pearson's correlation), categorical (uncertainty coefficient), and categorical-numerical (correlation ratio) datatypes, providing comprehensive information for diverse data types.
- Type Inference: Automatically detects numerical, categorical, and text features, with the option for manual overrides if needed.
- Summary Information: Gain insights into type, unique values, missing values, duplicate rows, and the most frequent values within the dataset.
- Numerical Analysis: Explore numerical features with statistics such as min/max/range, quartiles, mean, mode, standard deviation, sum, median absolute deviation, coefficient of variation, kurtosis, and skewness.
Installation:
To get started with SweetViz, install the library along with other necessary dependencies using the following command:
%%capture
! pip install -U sweetviz ydata-profiling
Basic Example:
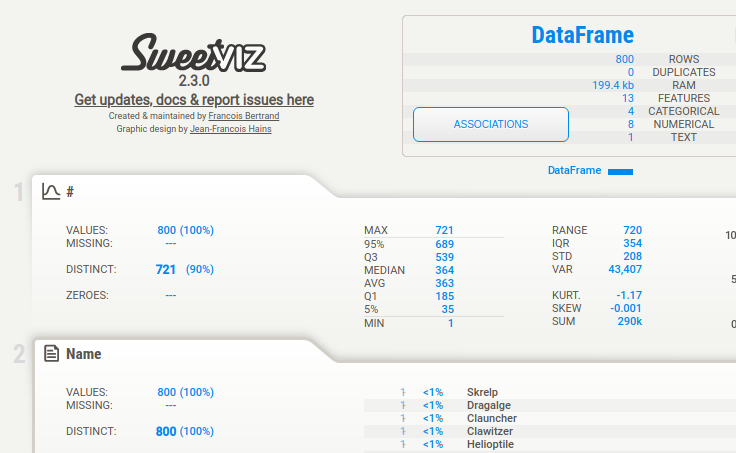
Performing a basic EDA with SweetViz involves just two lines of code. In the example below, we analyze a Pokémon dataset and generate a detailed report:
import sweetviz as sv
import pandas as pd
from ydata_profiling.utils.cache import cache_file


file_name = cache_file(
    "pokemon.csv",
    "https://raw.githubusercontent.com/bryanpaget/html/main/pokemon.csv"
)

pokemon_df = pd.read_csv(file_name)

my_report = sv.analyze(pokemon_df)
my_report.show_notebook()
Comparing Two Dataframes:
SweetViz extends its capabilities to compare two datasets, such as training and test sets. In this more complex example, we examine the differences in the "Attack" feature:
from sklearn.model_selection import train_test_split

X = pokemon_df[['Total', 'HP', 'Attack', 'Defense', 'Sp. Atk', 'Sp. Def', 'Speed']]
y = pokemon_df[['Type 1', 'Type 2']]

X_train, X_test, y_train, y_test = train_test_split(
    X, y, test_size=0.33, random_state=42)

train_df = X_train
test_df = X_test

comparison_report = sv.compare(train_df, test_df, target_feat='Attack')
comparison_report.show_notebook()
Empower your data exploration journey with SweetViz, creating visually appealing and informative reports with minimal effort. Whether you're a data scientist, student, or researcher, SweetViz offers a user-friendly approach to gain quick insights into your datasets.