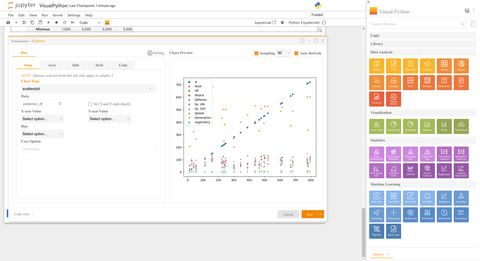
Visual Python: Simplifying Data Analysis for Python Learners
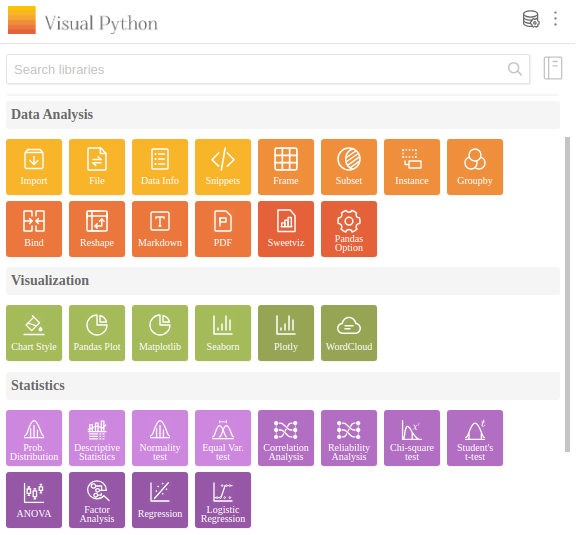
Visual Python appears as an intuitive GUI-based Python code generator, seamlessly integrated with Jupyter Lab, Jupyter Notebook, and Google Colab. Additionally, users can opt for the standalone Visual Python Desktop. This open source project was launched to help students navigate Python for Data Science courses, providing a streamlined approach to coding.


Key Benefits:
- Data management with minimal coding: Visual Python makes it easy to manage large data sets with minimal coding skills, making it ideal for beginners.
- Overcome Learning Barriers: Designed for students, business analysts, and researchers, Visual Python helps overcome learning barriers associated with Python programming.
- Snippet Management: Effortlessly save and reuse frequently used code snippets.
Installation:
To harness the power of Visual Python, install the required packages using the following command:
%%capture
! pip install -U jupyterlab-visualpython plotly wordcloud
Example with Pokémon dataset:
Let's explore the capabilities of Visual Python using the Pokémon dataset. This example demonstrates how Visual Python generates code for a word cloud, providing a visual representation without needing to memorize the complex syntax of matplotlib.
import pandas as pd
from ydata_profiling.utils.cache import cache_file
from wordcloud import WordCloud
from collections import Counter
import matplotlib.pyplot as plt
%matplotlib inline

file_name = cache_file(
    "pokemon.csv",
    "https://raw.githubusercontent.com/bryanpaget/html/main/pokemon.csv"
)

pokemon_df = pd.read_csv(file_name)
counts = Counter(pokemon_df[["Type 1"]].to_string().split())
tags = counts.most_common(200)

wc = WordCloud(max_font_size=200, background_color='white', width=1000, height=800)
cloud = wc.generate_from_frequencies(dict(tags))

plt.figure(figsize=(8, 20))
plt.imshow(cloud)
plt.tight_layout(pad=0)
plt.axis('off')
plt.show()
Descriptive statistics and visualization:
Visual Python extends its capabilities to descriptive statistics and data visualization. The code snippet below shows how Visual Python simplifies the process, generating graphs and statistics with minimal effort.
import numpy as np
import pandas as pd
import matplotlib.pyplot as plt
import seaborn as sns
import plotly.express as px
from plotly.offline import init_notebook_mode
import pyarrow as pa

init_notebook_mode(connected=True)
%matplotlib inline

vp_df = pokemon_df[['HP', 'Attack', 'Defense', 'Speed']].copy()
vp_df.head()
Descriptive statistics
from IPython.display import display, Markdown
display(pd.DataFrame({
    'N Total':vp_df.shape[0],
    'N Valid':vp_df.count(numeric_only=True),
    'N Missing':vp_df.loc[:,vp_df.apply(pd.api.types.is_numeric_dtype)].isnull().sum(),
    'Mean':vp_df.mean(numeric_only=True),
    'Median':vp_df.median(numeric_only=True),
    'Mode':vp_df.mode(numeric_only=True).iloc[0],
    'Sum':vp_df.sum(numeric_only=True),
    'Minimun':vp_df.min(numeric_only=True),
    'Maximum':vp_df.max(numeric_only=True),
    'Range':vp_df.max(numeric_only=True) - vp_df.min(numeric_only=True),
    'Std. deviation':vp_df.std(numeric_only=True),
    'S.E. mean':vp_df.std(numeric_only=True)/np.sqrt(vp_df.count(numeric_only=True)),
    'Skewness':vp_df.skew(numeric_only=True),
    'Kurtosis':vp_df.kurtosis(numeric_only=True),
    'Percentile: 25':vp_df.quantile(q=0.25, numeric_only=True),
    'Percentile: 50':vp_df.quantile(q=0.50, numeric_only=True),
    'Percentile: 75':vp_df.quantile(q=0.75, numeric_only=True),
}).round(3).T)
Frequency table
for col in vp_df.columns:
    if pd.api.types.is_numeric_dtype(vp_df[col]) and  vp_df[col].value_counts().size > 10:
        _bins = 10
    else: _bins = None

    _dfr = pd.DataFrame({
              'Frequency':vp_df[col].value_counts(bins=_bins, sort=False),
              'Percent':100*(vp_df[col].value_counts(bins=_bins, sort=False) / vp_df[col].size),
              'Valid percent':100*(vp_df[col].value_counts(bins=_bins, sort=False)/vp_df[col].count())
}).round(2)
    _dfr['Cumulative percent'] = _dfr['Valid percent'].cumsum()
    _dfr.loc['N Valid',:] =  _dfr.iloc[:,:3].sum()
    _dfr.loc['N Missing','Frequency'] =  vp_df[col].isnull().sum()
    _dfr.loc['N Total','Frequency'] =  vp_df[col].size
    display(Markdown(f"### {col}"))
    display(_dfr)
Charts
import seaborn as sns
import warnings
with warnings.catch_warnings():
    warnings.simplefilter(action='ignore', category=Warning)

    display(Markdown("### Histogram"))
    idx = 1
    for col in vp_df.columns:
        plt.subplot(2,2, idx)
        if pd.api.types.is_numeric_dtype(vp_df[col]) and  vp_df[col].value_counts().size > 10:
            sns.histplot(data=vp_df, x=col, kde=True)
        else:
            sns.countplot(data=vp_df, x=col)

        if idx < 4:
            idx += 1
        else:
            idx = 1
            plt.tight_layout()
            plt.show()

    display(Markdown("### Scatter Plot"))
    pd.plotting.scatter_matrix(vp_df, marker='o', hist_kwds={'bins': 30}, s=30, alpha=.8)
    plt.show()

    display(Markdown("### Boxplot"))
    sns.boxplot(vp_df)
    plt.show()
Seaborn visualization with Visual Python:
Visual Python makes creating Seaborn charts and graphics simple. No need to dig through the documentation; Visual Python works as a templating system, generating code that can be easily modified.
sns.scatterplot(data=pokemon_df, x='HP', y='Defense', hue='Attack', color='#d6d6d6')
plt.legend(loc='upper right')
plt.title('Pokemon')
plt.xlabel('HP')
plt.ylabel('Defense')
plt.show()
Strengthen your Python learning journey with Visual Python, reducing barriers to data analysis and visualization, especially for those accustomed to Excel, Power BI and SAS in the area of government national statistical organizations.