Overview
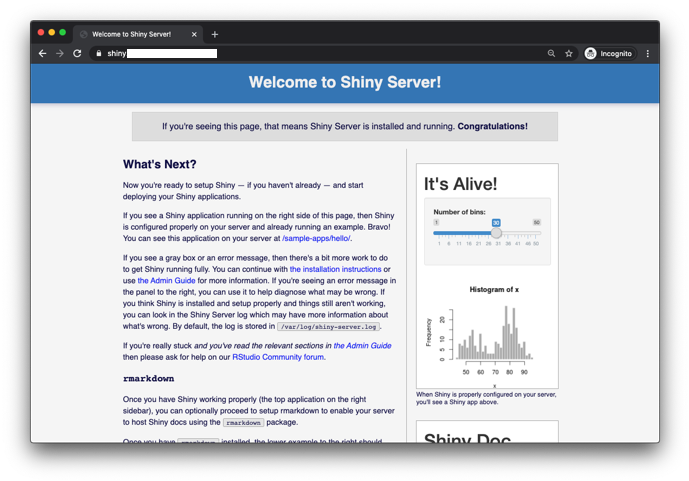
R-Shiny is an R package that makes it easy to build interactive web apps in R.
R Shiny App Hosting
We currently do not support hosting R Shiny apps but you are able to create them. We want to enable R Shiny app hosting in the future.

R Shiny
Publish Professional Quality Graphics

R Shiny is an open source web application framework that allows data scientists and analysts to create interactive, web-based dashboards and data visualizations using the R programming language. One of the main advantages of R Shiny is that it offers a straightforward way to create high-quality, interactive dashboards without the need for extensive web development expertise. With R Shiny, data scientists can leverage their R coding skills to create dynamic, data-driven web applications that can be shared easily with stakeholders.
Another advantage of R Shiny is that it supports a variety of data visualizations that can be easily customized to meet the needs of the project. Users can create a wide range of charts and graphs, from simple bar charts and scatter plots to more complex heatmaps and network graphs. Additionally, R Shiny supports a variety of interactive widgets that allow users to manipulate and explore data in real-time.

R Shiny is also highly extensible and can be integrated with other open source tools and platforms to build end-to-end data science workflows. With its powerful and flexible features, R Shiny is a popular choice for building data visualization dashboards for a wide range of applications, from scientific research to business analytics. Overall, R Shiny offers a powerful, customizable, and cost-effective solution for creating interactive dashboards and data visualizations.
Use R-Shiny to build interactive web apps straight from R. You can deploy your R Shiny dashboard by submitting a pull request to our R-Dashboards GitHub repository.
R Shiny UI Editor
The following Rscript installs the required packages to run shinyuieditor on the AAW. It starts with installing the necessary R packages and uses conda to install yarn.
Once the installation has finished you can access your app's code in ./my-app
Run this script from inside rstudio. RStudio may ask for permission to open a new window if you have a popup blocker.
Choose an App Template
The first thing you'll see is the template chooser. There are three options as of this writing (shinyuieditor is currently in alpha).

Single or Multi File Mode
I recommend Multi file mode, this will put the back-end code in a file called server.R and front-end in a file called ui.R.

Design Your App
You can design your app with either code or the graphical user interface. Try designing the layout with the GUI and designing the plots with code.

Any changes you make in shinyuieditor will appear immediately in the code.

Any change you make in the code will immediately appear in the shinyuieditor.

Publishing on the AAW
Just send a pull request!
All you have to do is send a pull request to our R-Dashboards repository. Include your repository in a folder with the name you want (for example, "air-quality-dashboard"). Then we will approve it and it will come online.
If you need extra R libraries to be installed, send your list to the R-Shiny repository by creating a GitHub Issue and we will add the dependencies.

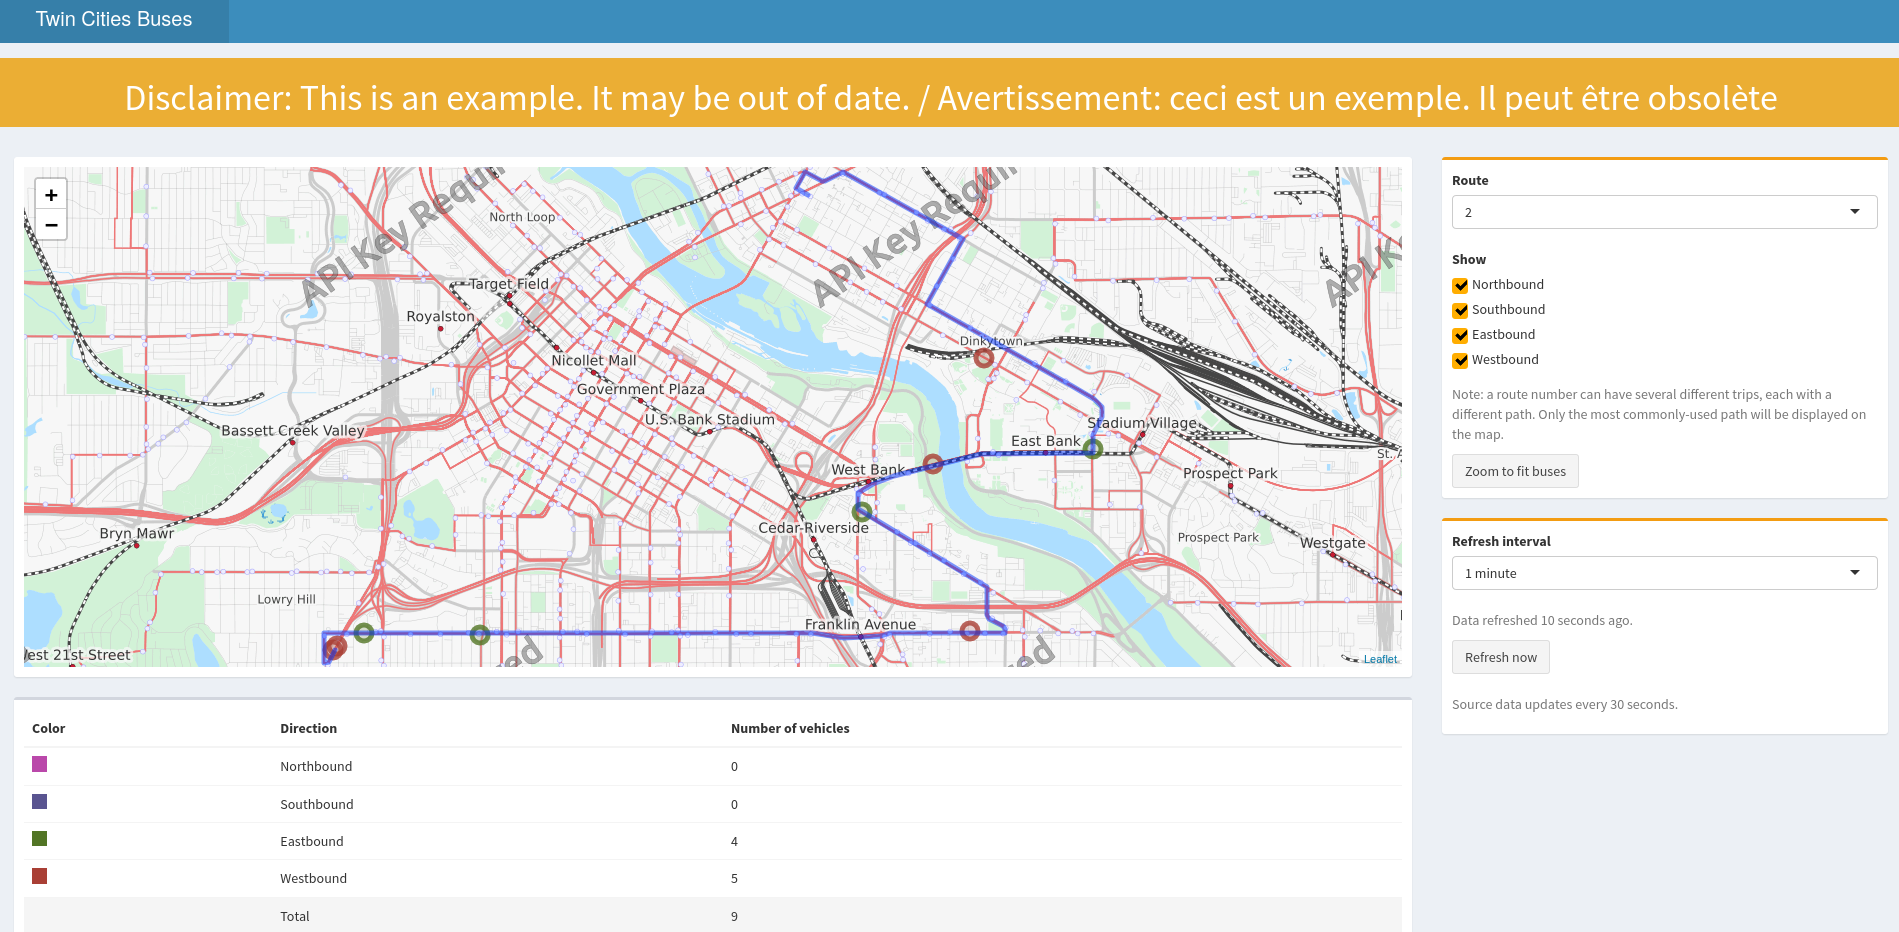
See the above dashboard here
The above dashboard is in GitHub. Take a look at the source).
Once you've got the basics ...
Embedding dashboards into your websites
Embedding dashboards in other sites
We have not had a chance to look at this or prototype it yet, but if you have a use-case, feel free to reach out to engineering. We will work with you to figure something out.